Call Windows Support

  • Subscribe to our RSS feed.
  • Twitter
  • StumbleUpon
  • Reddit
  • Facebook
  • Digg
Showing posts with label web. Show all posts

Sunday, 1 December 2013

that's not in the least bit suspicious

Posted on 03:35 by Unknown
Our internet connection at home travels along the same piece of wet string as does our phone line.  (I’m assuming it’s wet string, based on the bandwidth it achieves.)  Recently it’s been a bit glitchy, dropping out at random moments.  Then the other day I spotted a correlation: it drops out when the phone is in use.  This hasn’t always been the case: I’ve been on the phone to support while using my machine, so this is something new.

We spent a while trying to narrow the problem down. Was it answering, being connected, or hanging up the phone that triggered the event?  No, it was simply calling the number.  Was it one of the filters separating the phone and internet signals?  We tried swapping in and out these gadgets.  Eventually we had pared the system down to a single filter, with no handsets even connected.  Same problem.  Either all 7 filters are broken (not totally implausible, they are cheapo dinguses, all over 10 years old), or the problem lies elsewhere.

What will probably look weird, if not downright suspicious, to anyone monitoring us (not that anyone would do such a thing, obviously...) is what was visible from outside.  To see when the network went down, we watched the blinkenlights on the router.  To load the network during tests, we downloaded a YouTube video, let it play about halfway through to check the network was stable, then called the landline from a mobile, which stopped the network.

The result of this is that we downloaded the same YouTube video, and interrupted its download halfway with a call from a mobile, about 20 times. Moreover, because the network connection dropped out, it would re-establish with a different IP address each time, as provided by our ISP.

Oh, and what was this ultra-suspicious video?  Bonnie Tyler’s Total Eclipse of the Heart, obviously.
Read More
Posted in Bonnie Tyler, computer, web | No comments

Saturday, 5 October 2013

Martin Magnus on Kindle

Posted on 13:30 by Unknown
There are books that we’ve seen, usually read, and want to own, but can’t find available (or sometimes, affordable!) copies.  Then the hunt is on, scouring the second hand lists, lurking, waiting, and, if we are lucky, pouncing.

We each had a classic example of this from our childhood.  Charles was after Martin Magnus on Mars, the third in the series, only ever published in hardback, and tough to find.  So tough that, before the advent of the web, Charles was seriously wondering if he’d just imagined it! However, he eventually spotted a copy for sale, and pounced.

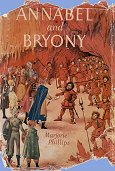
I had a similar story with Annabel and Bryony, a delightful children’s book I read when much younger.  I did at least know it existed, since my sister had a copy.  Eventually, after much hunting, I got my own copy, a present from my sister who had spotted it lurking in a second hand bookshop in Robin Hood's Bay.  And later still, thanks to my review of it on the web, I got a further trilogy.

This evening, Charles announced: “Such a long challenge, rendered insignificant.  Martin Magnus on Mars is on Kindle!”  And so it is.  At least we paid only a couple of quid for the hardback.  And there is something different about a physical copy.

Wait, I thought.  If MMoM is on Kindle, what about A&B?  Sure enough, it too can now be had in non-dead tree format.

The times they are a-changin’.  But I wouldn’t part with my hardback copy, battered dust jacket and all.
Read More
Posted in books, web | No comments

Monday, 26 August 2013

Trello

Posted on 06:12 by Unknown
I’ve read and enjoyed some of Joel Spolsky’s Joel on Software posts, in dead tree format.  So the other day, I was link surfing, followed a link to his site, and ended up reading How Trello is Different, a mere 18 months after it was originally posted.

I was taken with the sentence: “The great horizontal killer applications are actually just fancy data structures.” Trello is a “team coordination system” that is a fancy data structure comprising a “list of lists”. (Actually, it is a list of lists (boards) of lists of lists (cards) of lists of lists (checklists); or tree, as we say in the trade.)

The point is that any killer app can be used for multiple different purposes, mostly not thought of by the original developer: Excel, for example, isn't just a calculator, it’s used for almost anything that needs tables.

So Trello is good for any task that needs lists of lists – including to do lists. I hadn’t consciously been looking for a to do list manager, as I was happily using Toodledo. Toodledo is great for to do lists, but I was finding that maybe I wanted something with a little more structure: not just a single to do list, but ... a list of lists! The pro version of Toodledo has more capabilities, but that requires a subscription. So, finding Trello felt like serendipity, and I decided to give it a try (it’s free, and web-based, like so many things nowadays; there is a pro version, but it looks well beyond my needs).

And it’s really great. I now have (a list of) seven boards, the major list category: think project, or similar large slice of life. I have one for teaching in general, one for a specific module I’m teaching, one for research, one for tracking my research students, one for travel and events, one for miscellaneous to do items, and one for template lists.

Each board has several lists: categories of tasks or items in that board. So my specific module teaching board has a list for lectures, for practicals, for seminars, for the web site, and for the assessment.

These lists are just called lists. They are lists of cards. Each card is a task or other specific unit of work. So my practicals list has a card for the preparation I need to do for each individual practical, and a further card for things I need to do for all the practicals. Lists, and cards within lists, can be dragged around to reorder things how you want.


It doesn’t stop there. There’s loads of data that can be associated with a card. Flip the card over, and there’s a free text field, a due date, coloured tags, a list of activities (things that have happened with the card), a list of checklists, and more. Each checklist is itself a list of check items. And that’s as far down as the lists go, I think.

For the group working part, multiple people can be members of a board, can be assigned different cards, and so on.

I’ve been using Trello for a few weeks now, and it fits in very smoothly to my workflow. There’s an “all cards” view that you can use to show cards with a due date, in date order, so I can easily see what’s urgent.


I liked it enough to want to use it permanently. But there was one issue: backup. The data is stored on the Trello server. If I lost my to do list, I would be in deep trouble. I went to the help page, searched on “backup”, and found:
To export your data, simply open a card or open the sidebar Menu, then click the ‘Share, Print, and Export’ button, and you’ll find export options. Currently, we allow export to JSON, which is a format that lends itself well to Trello’s specific data storage model.
Yes, but if Trello disppears, how will that help me? (I have no reason to believe Trello will disappear. But, I'm paranoid about backups.) I clicked the export button, and was delivered a .json file. I decided to see how easy it would be to extract my to do life from the file. I wrote a little Python and CSS, and converted the relevant bits of the file to HTML:


The CSS just formats to HTML to look like the original Trello board. It looks a bit different, because I added the info from the back of the card to the front in this backup display.

So that’s okay, then. I can recover the data, provided I remember to backup the boards. But that’s a bit boring, having to backup seven boards individually. Boring backups are no good: they tend to get skipped. So I went back to the site to see if there was a command to backup all the boards in one go. No, but there is an API; I’d seen that originally, but forgotten about it.

The API lets you get and set your data remotely. So I modified my Python script to read from URLs rather than JSON files, and voila, backup of the entire set of boards with a single click.

So now I’m happy, and will go over to Trello. And I’m not even scratching its surface yet: I haven’t made any use of the multi-person aspects so far. I may think about doing that on a new project that’s about to start up.
Read More
Posted in python, web | No comments

Sunday, 4 August 2013

a new piling system

Posted on 04:15 by Unknown
I write academic papers, and read a lot of other papers. What with hard copy scattered through filing cabinets, and soft copies on a wide variety of websites, it can be hard to keep track of what I’ve read, made notes on, made BiBTeX citation data, and referenced.

Nearly two years ago I had a go at using Mendeley, designed to help with this very task. But for some reason, it never gelled for me, and I gave up using it. Then, when I became an Evernote convert, I fiddled about with using it to store data on the papers: author, title, etc, notes, BibTeX, and links to the papers themselves. But it was clunky work-flow, requiring a lot of hand-effort. Only the note keeping part of it worked well.

Then a colleague raved about Paperpile on his G+ stream. I had a look. It has a similar concept to Mendeley and other such systems, keeping references, supporting tags, good searching, associated notes, and citation output in multiple formats (although I only care about BibTeX). Instead of being a stand-alone application, however, it’s Chrome-based, and uses your Google Drive as a repository to store your papers. It’s currently in Beta, and I thought I’d give it a try. I emailed off for an account, and about a week later I got one.

The first thing I did was import my dusty Mendeley data (with a single button click and a log on), so I started off with a well-populated, if slightly out-of-date, database. I decided to trial it on the paper I had just started writing.

I defined a tag for the new paper. As I was writing, each time I included a reference in the text, I checked if that reference was already in my Paperpile database; if not, I added it. (Since there is usually a fair amount of overlap between bibliographies of papers in a similar domain, this should get faster as the db gets more populated.) Then I tagged it with the paper’s tag, and any other relevant tags.

My current Paperpile db, with 321 entries

To generate the BibTeX, all I needed to do was select the tag, which selected all the references, and then export the whole BibTeX file in one go.

The real benefit showed up when I got comments back on a draft of the paper. One was about a short quotation I had included, and I needed to find the quotation in its original context in order to address the comment. Click the Paperpile tab in Chrome. Type the author’s name into the search box; the paper’s details appear. Click the “view PDF” button. Voila! The paper is on my screen! I can’t think of a faster way to achieve that, without using telepathy.

You can upload in various ways, including PubMed, arXiv, doi, navigating to a website, or just giving it a PDF.  When you upload a PDF directly, the system searches the web to find the right data to populated the various fields. It gets this mostly right, but there have been a couple of odd peculiarities. Still, the system is in Beta. I reported the couple of weird results, and got very fast and helpful responses from the team. (I like Beta testing. I can whinge about software, and feel virtuous about doing so!)

One thing I particularly like is that the uploaded PDFs are stored in my Google Drive in a very sensible way. The files have obvious names: <Author> <Year> - <Title>.pdf. So if Paperpile were to disappear for any reason, I still have all my PDFs in a very usable form. (I’m not expecting it to disappear; I’m just paranoid: I have my Google Drive synched to my hard drive at home, in case Google disappears!)

I haven’t used all the facilities, in particular, I haven’t exploited the Google Docs integration. The Paperpile team report that some people are using it to write their papers collaboratively in Google Docs. That looks potentially useful, but I don’t use this plain format: I write my papers in LaTeX/BibTeX, using TeXnicCenter.

One part of the system I probably won’t use that much is the notes field. It’s perfectly fine, but I like to keep more substantial notes, with formatting, sketches, figures, and the like. So I’ll continue using my Evernote “papers” notebook, but now just for the notes, not the entire paper and other detials. For a paper with notes, I add a link from the Paperile entry to the relevant Evernote note, using the URL field which gives a clickable link (and I add an Evernote tag, to make it clear to me that there is a note). Similarly, I have a lot of already existing book reviews on my website. So when I include a book that I own, I add a link to the review on my site.

In fact, I think that having a variety of tools that each does their own thing well, with links between the relevant parts, works better than trying to shoehorn all capability into every application. So in Evernote, for example, for a meeting note, I don’t copy the agenda from the email notification, I just store a link to it. Evernote Webclipper allows you to clip the whole email into Evernote, but that just seems to cause unnecessary duplication. It’s good practice to keep only one copy of data (except for backups, of course!), otherwise there is the potential for copies to get out of synch. When that agenda is inevitably later updated, and a new copy emailed out, I don’t have to do anything: provided it is sent out with the same subject line, the Gmail link pulls up the entire conversation, and I can select the most recent agenda. (One day, the agenda setters may start using Google Docs, and so everyone will always have the most up to date version – provided they haven't clipped it into Evernote!) With all these web-based tools, the URL can link everything together.

In summary: first impressions of Paperpile are very favourable. I’ve successfully and productively used it for writing a paper, and it being web/Google based means it’s available at work, at home, and elsewhere, without me having to do anything special. I’ll report on progress if and when it gets more deeply integrated into my web-life.

Read More
Posted in Evernote, LaTeX, publishing, research, science, web | No comments

Saturday, 13 July 2013

waspish caterpillar

Posted on 08:12 by Unknown
I read recently, in the "Last Word" section of New Scientist, a piece asking for help to identify an Italian butterfly-like creature.  The questioner couldn't identify it because "it doesn't seem like any butterfly I've seen, nor is it in any of my insect books".  What caught my eye was the implication of ownership of at least three insect books.  We have only the one insect book.  And two butterfly books.  Oh, and a dragonfly book.

Yet none of our books could help us to identify this splendid caterpillar we found in the garden today.
at least it's on a weed
The reason I know that none could have helped is that I looked it up in them, after I had identified it using the web.  To identify it in the first place, I googled "caterpillar black yellow stripes", and got

it seems there are rather a lot of caterpillars using a yellow and black colour palette
Looking through the results identified several promising candidates.  The respective source pages all identified it as the caterpillar of the Cinnibar moth.  The wikipedia page has more details, confirming the identification.  But our insect book doesn't have it.  Neither do our butterfly books (well, it is a moth, I suppose).

Back in the garden, the spiders (which will obviously not be in our insect book) have been busy wrapping up the plants in a dense web.


And the patio roses we bought back in early May are now blooming their hearts out.
The labels must have lied about the colours.  I think we are going to have to separate these!

The weeds are growing apace, but it's way too hot at the moment (28°C) to garden.  So I'm blogging about the garden instead.
Read More
Posted in books, garden, weather, web | No comments

Sunday, 23 June 2013

boxes, whiskers, and violins

Posted on 04:41 by Unknown
My experiments with the charting language d3 continue.  I'm looking at different ways to display book review statistics.  For example, I'm interested in how long books sit on the shelf between being bought, and being read.  It can be a long time; but how long?

A scatter plot shows all the data:


Here I have colour-coded book types as purple for non-fiction, green for science fiction, and orange for other fiction.  The existence of the line is clear: I can't read books before I acquire them.  (The green dot below the line in 1998 is an anomaly: either the acquisition date or the review date is wrong.  I have investigated, but can't determine which, so have left it as it is.)

The scatter plot shows all the data, and provides a visual clue that maybe the time between acquisition and reading isn't too long.  (Of course, this only shows the books I've acquired and read, not the ones I've acquired and are still languishing on the unread shelves!)

In order to better visualise the time delay, I plotted the data as box-and-whisker plots (showing median, quartiles, outliers, and here also the mean), overlayed with violin plots, (showing a more detailed estimate of the underlying distribution):


This was all relatively easy to do using the d3 chart library, and Jason Davies' science.js library for the kernel density estimator needed for the violin plot.

So from this I can see that I tend to read fiction almost as soon as I buy it, SF quite soon after, and that non-fiction sticks around on the shelves for longer.  This probably indicates that I buy non-fiction partly as an investment (it's my pension fund!).

Maybe I should spend more time reading them, and less time learning new languages so I can analyse how fast I'm reading them?

Read More
Posted in books, graphics, statistics, web | No comments

Monday, 17 June 2013

book review statistics in d3

Posted on 06:55 by Unknown
My experiments with the charting language d3 continue.  Now that I can happily import csv files, I decided to have a go at visualising some data about the various book reviews on my website.

First, I charted the cumulative number of reviews, of the fiction, SF, and non-fiction books:


I was surprised at the total number of reviews, as I 'd never seen this all in one place before. And I was also surprised at the relatively steady rate of reading demonstrated.

I wrote a little python script to extract the figures from the database into a csv file.  I discovered that a few weeks of writing JavaScript seems to have over-written a large chunk of python syntax in my brain...

I also had a go at viewing the data according to date of publication, of acquisition, and of review.  I'm still playing around with those views, working out what they can show.  More experimentation is needed.
Read More
Posted in books, graphics, statistics, web | No comments

Sunday, 9 June 2013

rainfall statistics in d3

Posted on 07:03 by Unknown
My explorations of the d3 data visualisation library for JavaScript continue apace.  I have now added "box-and-whisker" plots to the 2012 rainfall, helping demonstrate the anomalously wet April and July, and dry August, last year.  This required calculating the various means, medians and quartiles, which wasn't particularly difficult, and has given me a feel for working with arrays.
Box and whisker plots show minimum, lower quartile, median, upper quartile, and maximum.
The mean value is overlayed as a blob.
This latest version replicates the previous chart displaying this information, which I did in Excel. (The bars are slightly different, because here I have included the 2012 data in the statistics, whereas I excluded it in the previous version.)

I think this d3 version looks much cleaner.  It certainly lets me fiddle with things at the programmatic level I prefer!
Read More
Posted in graphics, statistics, weather, web | No comments

Saturday, 8 June 2013

interaction with d3

Posted on 14:35 by Unknown
My explorations of the d3 data visualisation library for JavaScript continue.  Last weekend I dipped my toe in the water, and drew some simple rainfall charts.  The code was clunky, and the data was hardwired, but the charts were pretty enough to convince me to continue.

And so this weekend I've explored some more.  I've modified the code to read in the data from a csv file, and then refactored like mad to make it more elegant.  The result of half a day's work was a web page indistinguishable (on the surface) from before: but now the charts, and the headings, are generated from the csv file data, so I can add more data each month, and the page will update without any code having to change.  So, a success.

Then I decided to add a little bit of interaction: changing the colour of a bar or spot on mouse-over, and showing the actual data value.  The d3 library is powerful enough that it was very easy to do.

in May 2007 we had 76mm of rain

in July 2009 we had 63mm of rain
So that's some tasks completed off my to-do list.  I've still got a long way to go.  But, as when I was learning Python, I'm finding StackOverflow an invaluable resource.

The actual web page is here, but it may change over time as I add more functionality.
Read More
Posted in graphics, statistics, weather, web | No comments

Sunday, 2 June 2013

my first d3

Posted on 04:17 by Unknown
Way back when I was an undergraduate, I stumbled across a book called Curve Tracing, by Percival Frost.  The college library had a first edition, published in 1872.  Several years later, I came across a newer edition in a bookshop, and grabbed at it.

This beautiful little book has tons of curves defined by equations, and shown as graphs.

Plate IV from Curve Tracing
This was all originally done in the days before computers.  It's been a goal of mine to reimplement some of this work, in an interactive form, because many of these curves have parameters that affect their detailed shape.  So, I've been looking for a suitable tool.

Also, I'm interested in data visualisation (and have long been a disciple of Tufte).  I've tried to follow the "no chartjunk" ethos in my own work.  For example, to plot our rainfall statistics, I had to struggle with Excel charts to remove most of the garish "ink" provided by default. But it's still not perfect.  Additionally, I have some specific work I want to do with modified parallel coordinates, for which there is no existing library.  So, I've been looking for a suitable tool.

Last week a colleague of mine mentioned d3, a JavaScript library for Data-Driven Documents. I browsed the gallery for a while, and fell in love.  I spent yesterday playing around with evaluating it, on simple charts, to see what it could do.  This meant reading Scott Murray's d3 tutorial, and implementing a few simple charts to show the rainfall data. (Oh, and learning my first JavaScript.)

First off, I tried a simple bar chart, starting from Murray's tutorial example (when learning a new language, I usually find it easier to modify existing code than start from an empty file). After fiddling around to get the ordinal x-axis working, I got:
d3 chart of 2012 rainfall in mm
I think that looks suitably chartjunk-free and minimal.  It also has the nice feature of combining the actual numerical values into the bars, giving what Tufte calls both a macro-reading (the bars: gosh, July was wet!) and a micro-reading (the numbers: July had 113mm of rain) in one chart.

What's nice about d3 is the way the axes scale automatically.  Exactly the same code produced these charts (the only difference is the July data value: 13, 113, 233):

automatic axis scaling with changing data values
But, of course, we have several years of rainfall data.  A little more hacking coding gave me a grouped bar chart:
rainfall, June 2005 -- May 2013
Now it's possible to see how wet April 2012 was, compared to normal Aprils, even if it wasn't as wet as that July!  My implementation of this is a little kludgy, with too much hard-wiring, since my goal was to evaluate the capability, not (yet) learn the entire language; my next task is to code it more elegantly.

I've always found grouped bar charts rather cluttered, and so I wondered if there was a better way to show the data.  Rather than use some sort of surface plot, I decide to try a projection where the size of a spot is related to the amount of rainfall.  With a surprisingly small change to the code, the grouped bar chart metamorphosed into a "blob" chart:

(left): blob area proportional to monthly rainfall; (right) blob radius proportional to monthly rainfall
This enables comparisons in both dimensions (years, or months), depending on whether you view rows or columns.

So, based on a day's work, I'm very impressed with d3.  However, there are a lot more d3 facilities I need to get up to speed with before I can start my reFrost project in earnest:

  • csv data import -- currently the data is hard-wired into the scripts (ugh)
  • data manipulation -- to calculate medians and quartiles for box and whisker plots
  • lines -- to draw graphs rather than charts
  • maths -- to calculate the functions: and, presumably I'll need a lot more JavaScript
  • interaction -- so parameter values can be chosen by the user
  • transitions -- so the graphs will smoothly change as parameters are varied
  • more -- stuff I don't know about yet, but will need

So, a way to go, but I think I might have identified the tools I need.

Read More
Posted in graphics, statistics, weather, web | No comments

Wednesday, 8 May 2013

Ctrl-Shift-T

Posted on 13:25 by Unknown
We've gone over to using Google products at work.  For the most part, I like Google Mail.  It has its quirks, but the selling point for me is that, being browser based, mail items have URLs, so I can just paste the relevant URL into my to-do list or Evernote daybook, rather than clutter up my inbox with emails I'm waiting to action or need for meetings.

However, Gmail has a user interface feature I just keep getting wrong.  I consistently click the "Compose" button to move to my contacts, instead of clicking the "Mail" menu, and selecting from there.

I keep clicking "Compose", instead of selecting "Contacts".  Why?

I don't know why I keep doing this (maybe because the first two letters are the same?), but I do.  All the time.  I don't blame myself: I have been well-enough educated in user interface design to believe that if the user consistently makes a mistake like this, the UI is to blame.

This particular mistake is not that serious: I just have to keep binning unwanted empty emails (and muttering imprecations at the interface).  But there's another mistake I keep making, this time with the Chrome browser: I often hit "close tab" instead of "back" when I finish reading a linked page.  And then I've lost that tab's history, in particular, the page I was trying to return to when I closed the tab.

But then the other day, I discovered that all is not lost!  Hit Ctrl-Shift-T, and the tab is automagically resurrected.  Hit it again, and the previously closed tab reappears. And so on. Yes!  A key combination to undo a user interface infelicity.

So why isn't this option in the menu?


Read More
Posted in computer, Evernote, web | No comments

Saturday, 20 April 2013

antisocial networking

Posted on 06:59 by Unknown
I have had my website since the mid 1990s.  I have had this blog since early 2011.  But I have resisted social networking.  No Facebook, no Twitter, no nothing.  Until yesterday.

I have finally succumbed, to Google+.  A colleague had just set up a "community" for a small group of us to collaborate on our research project.  So I clicked for an account, joined his community, added people to circles, and stuff.

Then, in another meeting yesterday, we decided to set up another community, for a different research collaboration.  Zero involvement to two communities, in about six hours!

So I am now networking -- but only in gated communities. Antisocial networking, I suppose.
Read More
Posted in research, web | No comments

Sunday, 10 March 2013

normality has been restored...

Posted on 15:02 by Unknown
...partially, anyway.

When my home machine died, and I upgraded to Windows 7, my incredibly ancient 16-bit Smalltalk/V would no longer work.  As this was what I used to generate the book review pages on my website, it was a bit of a disaster.

So over the past several weekends, I've been re-implementing my book list program, from scratch, in Python, and the new pages have finally gone live.  (There are still broken links from the non-automatically generated pages; I'll fix those next.)

This was my first major foray into Python.  Three years ago, I wrote my first ever Python program -- a Game of Life implementation, using Gosper's hashlife algorithm -- but then didn't touch it again until recently.  Instead, I was using Matlab for all my number-crunching needs.  However, I needed something a bit more friendly for teaching some non-computer science students a little bit about simulation.  So before Christmas I wrote a small flocking program in Python, and a few little bits and bobs.  Then I learned about NumPy, which does a lot of the matrix stuff that Matlab does, so I thought I'd give it a try, by reimplementing some Random Boolean Network code I'd originally written in Matlab.

I was really impressed, so decided to do some more NumPy programming, to learn it better.  I wrote a few programs to support some practicals for a module I teach: a quantum random walk simulator, an iterated function system, and a 1D cellular automaton.  And after that exposure, I decided I was deeply in love with Python.

But the book list program is my biggest yet, by a long way.  All the previous programs had a core of essentially about 10 lines of code (each of those lines doing a lot, mind you!), each written in an hour or so.  The book list program is several hundreds of lines (many of which also do rather a lot), split over 5 files and several classes.  I also decided to take the opportunity to reorganise and tidy up the structure of my web pages, which involved writing a few utilities, to rename a bunch of files, to write a new table in the database, that sort of thing.  File handling. Database access. All amazingly simple in the marvellous language that is Python.

Although, frankly, I couldn't have done it without the wonderful Stackoverflow forum.  The Python documentation is useful if you know how to do something, and just need to check the syntax or method name.  It's not so helpful if you don't know how to do something. And Python has its own way of doing things.  But every time I typed into Google: "python how to  XXX", for a wide range of XXX, there was Stackoverflow with the answer -- often several answers!  Thanks, guys.

When I started writing this, I was consulting online resources for nearly every line.  But now, I'm happily typing things like
reviews = [bk for bk in have_reviews if bk.isNFBook()][0:10]
without looking things up any more.

And I'm now looking round for my next Python project...
Read More
Posted in algorithm, books, computer, python, web | No comments

Sunday, 3 February 2013

carry on installing

Posted on 10:54 by Unknown
So, after the sad demise of my home PC last week, it is off to our local computer shop, World of Computers (an excellent place where we have been buying our machines for the last two decades at least), for its replacement.

Back home, I plug in all the peripherals, and now I have a beefy spookily quiet machine with all my data transferred on to it (so at least I don't have to restore from backup), but essentially no software.  This is Windows 7; given some of the software running on my previous XP machine had been ported to it eight years ago from my previous Win95 machine, I may be in for a hard time.

First things first -- I install the security software.

Then I download Chrome and Evernote, and I'm ready to start serious installation, including taking notes to help me next time.  I set the wallpaper to a Hubble Deep Field image, and I'm starting to feel at home again.

The first thing I notice is that there's a thick black border around my monitor screen, and the text is slightly fuzzy.  I remember this happening when I first got it, and that I did something that wasn't to do with setting the resolution; but beyond that -- no recall.  However, the web comes to the rescue:  googling the problem reminds me it is called "overscan/underscan" -- googling that tells me to use Catalyst Control Centre.  Which is not installed, so that's my next download.

Full screen de-fuzzified, I next install MS Office.  That's a 1GB download, leading me to wish, not for the first time, that our internet broadband was fibre, rather than some species of wet string.  The Office download page provides me with download instructions in a pdf.  So I download Adobe Acrobat Reader.  Then I look at the download instructions, which are all out of date.  But the download and installation proceeds normally without their help.

Then it's Texnic Center and MiKTeX.  This all goes smoothly, and I test it on an existing LaTeX document.  Fine, except the spell checker doesn't work, as I have set it for English, rather than English (US).  It points me to a site of dictionaries, and I download one.  This needs to be unzipped.  So it's off to the 7-Zip website for that...

Next, Dropbox.  No problem, except that it is synching a gazillion files.

Then Skype.  This leads to the usual problems of ensuring that the speakers and the webcam microphone are plugged into the right sockets.  The sockets are colour coded; the jacks are not.  After grovelling about under my desk and swapping things around a few times to no effect, I google to find out which ones to use.  And now the sounds are going in the webcam microphone and coming back out the speakers a split second later.  More googling to fix that.

Now we come to the antediluvian software.  I use Quicken 2000 (yes, 2000) for my home accounts.  It doesn't install under Windows 7.  I consider upgrading, but various websites warn me that importing the data is hard to impossible.  (Well, after 13 years of upgrades, maybe that's not too surprising.) I wonder about changing to a different package, but, hey, I've been using it for 13 years with not problems.  So, install the XP emulator, and install Quicken in that.  Point Quicken at my backup data, and it's like old times.

I have less joy with the scanner.  There are no drivers for Windows 7, and the XP emulator can't be made to see the scanner at all (despite it being a USB device).  So I swap it for Charles' newer scanner (he's still running XP, so is okay for now), then download and install drivers and software for it.

Next, it's the software I use for my website.  I edit the pages in HoTMeTaL Pro 4.0, a Windows 95 application.  Although I still have the original CD (note for youngsters: software used to come on CDs, rather than being downloaded from the web), I decide not to bother installing it -- it is just a bit too long in the tooth now, particularly since I've started using a bit of CSS.  So I have a trawl around the web, reading reviews, and decide to give CoffeeCup a go.  Download, install.  (Once I've used it for a while, if I like it I'll upgrade to the full version; I might review it.)

Next, it's the software I use to take the text output exported from my Access book database, and produce the various book review pages on my website.  This application is written in Smalltalk/V for Windows, a 20-year old, 16-bit implementation of Smalltalk.  It does not run in the XP emulator.  I'm going to have to reimplement it in a different language.  I do have it on my to-do list to reimplement in Python, but it's a non-trivial exercise (ie, more than a weekend hack), so I've been putting it off.  Bother.  Oh well, at least I'll be able to make the improvements I've been thinking about.  But that means, my book pages probably won't be updated for a while...

Nearly two days have passed, and I've still got Python, an OCR tool, and a picture editing tool to go (I suspect my copy of Paint Shop Pro 3 is just a little out of date...)  But I can now function again.
Read More
Posted in computer, web | No comments

Sunday, 2 December 2012

Evernote as a laboratory daybook

Posted on 07:46 by Unknown
I started using Evernote three weeks ago.  I've been trialling it as my "daybook" at work, where I keep my notes of all meetings, projects, and any work-related items.  It's been very successful, so now I've switched over to it in entirety, and retired my hardbound logbooks.

One of my Evernote "notebooks" is my daybook.  For each day I keep a single note that's the "miscellaneous" stuff, plus a separate note for each scheduled event (lecture, practical, seminar, student supervision, project meeting, committee meeting, whatever).  I put a little thumbnail picture -- of the person, or something iconic for the meeting, in the note, which then shows up in the snippets window.  I've also made a set of "day" icons for the single "miscellaneous" note, that show the day, date, year, and week of term/vacation.  These thumbnails allow me to scan the snippets and usually find the correct note rapidly, without needing a search.

the end of last week
At the beginning of each day I add new notes for the meetings from my diary, and edit the "create time" to be the start time of the meeting.

I use templates for each of my semi-regular meetings.  When it's the day of the meeting, I copy the note from the template notebook, where it already has the right date and time.  When I know the time of the next occurrence (known in advance for regular meetings, sometimes agreed in the meeting, sometimes not agreed until after the meeting), I edit the template accordingly.  This means my template notebook also acts as a mini calendar of future appointments.  I found this useful within the first couple of weeks. I had forgotten to set the time of my next meeting with a student; still with the date of our previous meeting, their template was noticeably languishing at the bottom of the list, reminding me to do something about it.

At the beginning of a meeting, I select the relevant note, and can start typing straight away.  Also, I can "search" for the name of the meeting, and then the snippet window shows just these.  So I can quickly go back to an earlier meeting (eg, to look up what we agreed to do for this meeting).

Each meeting note has three sections:

  • pre-meeting notes: preparation for to the meeting (for a committee meeting this might be reports on any actions I've discharged; for a seminar it will be the speaker's abstract, etc; I also add links to relevant documents)
  • meeting notes: I have a 7" Netbook with a useable keyboard -- I've found I can type notes fast enough if it's on a table, or perched on my lap (although this is a bit uncomfortable on some chairs)
  • post-meeting notes: for example, any clarifications or further information I've looked up after a talk -- I find it useful to clip a few sentences from a relevant website to help illuminate some point a speaker has made

Rather than keep big pdfs in Evernote, I keep them in my Dropbox, and just put a link in the note.  Also, I can link to specific gmail conversations, for example, the one containing the agenda and minutes of the meeting.  This is a great aid to going paperless.

I use Evernote on my netbook for taking meeting notes, and on my main machine for making notes while I'm working at my desk.  A couple of times I've closed the netbook, sat at my desk, and started updating the meeting note, only to discover I haven't given it time to synchronise.  I now manually synchronise before I close the netbook.  However, I haven't lost anything, since Evernote keeps both versions, and puts them in a "conflicting changes" notebook.

One issue I have is with the automatic choice of image to use as the thumbnail in the snippet view. It automatically chooses "the image with the largest smallest dimension" (btw, it took me essentially no time at all to find that link, as I'd clipped it into Evernote when I was looking for it originally).  That's almost always the wrong choice for me: I want a thumbnail icon, such as a small photo of the person involved, which nearly always has the smallest largest dimension.  Since I often take whiteboard photos to accompany technical meeting notes, I can end up with a bunch of identical-looking whiteboard thumbnails!  I would much prefer being able to override the default.

But apart from that v minor niggle (and the printing issue noted below), I'm finding this almost perfect as a daybook.

Caveat: if you need to keep a formal logbook, with date stamps and signatures, you will need to find a way to print out your notes -- which is easy for a single note, but non-trivial as a batch exercise.
Read More
Posted in Evernote, web | No comments

Sunday, 11 November 2012

my magpie habits finally virtualised

Posted on 08:05 by Unknown
I'm in love ... with Evernote.

I first heard of apps to organise clippings, etc, several years ago, from Steven Johnson talking about DEVONthink in one of his books.  It sounded great, as I kept a paper commonplace book, and had an overflowing scrapbook, and wanted something more systematic to keep all those notes and thoughts and cuttings.  However, DEVONthink is Mac-only, so I started keeping an eye open for something else.

During my intermittent reviews of applications over the next few years, I came across Evernote, which seemed to be another alternative that people really liked.  But it too was Mac-only.  So I kept looking, experimenting with the odd app now and then, but nothing really seemed what I wanted.

Last week, I was having yet another look around.  This time, I was after something to keep an electronic laboratory day book, as my Word document version is too clumsy.  There didn't seem to be anything specific, and I was wondering whether to use a new blog, but in my web trawl, I again came across Evernote.  I noticed that now there is a Windows version, and an Android smart phone version.  I looked closer.  It seemed ideal for a clippings container.  I decided to give it a try, as a commonplace book at least.

I downloaded it to my home machine last Saturday, and experimented with it for a while.  I installed the Web Clipper app into Chrome, and started surfing/clipping.  I downloaded it to my phone, and played around some more.  It's got great searching capabilities, and a nice interface.  I particularly like the way the bullet lists work -- tab to indent, and return to outdent again -- very natural for note taking (where I am an inveterate bulleter).

my desktop version: snippet list on the left, detailed notes on the right

On Sunday, once I had a feel for what it could do, I decided I would also experiment with using it as a lab book. I planned to use one note per meeting/seminar/lecture, plus a "day note" for all the other bits and bobs that need recording on a given day.

Back at work, I downloaded Evernote to my work desktop and my netbook.  There I used it all last week, taking electronic notes in meetings, and during seminars.  It was really smooth.  For example, for one meeting I made a note that contained: what I'd done in preparation for the meeting; my notes typed in during the meeting; what I did to discharge the actions after -- all in one place.

Then I found the excellent blog of Jamie Todd Rubin, Evernote's "Paperless Lifestyle" Ambassador.  This opened my eyes to many other ways of using Evernote -- not just as a commonplace book and a lab book, but for other notes, projects, and whatever, and for automating various parts of the process.  I now have seven notebooks on the go, and more in mind.  (Although I probably won't go completely paperless.  But I am thinking of getting a faster scanner.)

I am seriously considering upgrading to the premium version, to get more monthly upload allowance, and some other nice perks.

Now all I need is for someone to port Penulimate to Android -- so I can scribble diagrams as well as textual notes in meetings.


Read More
Posted in computer, Evernote, grimoire, web | No comments

Sunday, 19 August 2012

citation patterns

Posted on 07:28 by Unknown
An academic's contribution to the community is made through publications.  And so we obsessively keep good records of what we have published, and neurotically check out if anyone has noticed.

To this end, I’ve been playing around with Google Scholar, tidying up my auto-generated publications list there. Although I still maintain my own publications page, this separate one is a useful resource, mainly because it includes citation counts and links.

Citation links are good for more than justegoboo and feeding neuroses, honestly! Citations indicate other authors who find my work relevant to them, so it's very likely that their work is interesting and relevant to my own research. It makes sense for me to check them out, and then also check out the other papers they reference, and also their citations, to see if there’s something interesting and relevant to me. Although it is a bit easy to get sucked into a never-ending death-spiral of link following: there’s just too much interesting stuff.

That's the beauty of Google Scholar.  it doesn't just have a list of my papers (a task I can do myself with relatively little effort); it also auto-generates links to citing papers (a task that would be ridiculously time-consuming to do myself).

More than that, it also provides neat little graphs of citations per year. These are quite interesting for publications that are several years old, where patterns have had time to emerge.

The typical pattern shows a peak a few years after publication, then a tail off into obscurity.


Slightly more gratifying is the pattern of a peak, followed by a drop, but then carrying on bumping along at about the same rate.


But the weirdest citation pattern must be to a paper written during my PhD, published nearly 30 years ago. It caused barely a ripple when published (I comfort myself that there was no Web in those days, and hence restricted access to it). But then there was a second (modest) peak of citations after about 15 years, followed by a drop-off. And then there was a third peak, starting more than two decades after publication.


Clearly, a paper ahead of its time!
Read More
Posted in astronomy, books, history, publishing, science, statistics, web | No comments

Friday, 10 August 2012

autumn is early this year

Posted on 13:31 by Unknown
As I was getting dressed this morning, I felt something lightly fall on my foot.  I looked down, and saw something scuttling away.  Tracking it down I found:


These big "house spiders" are seen indoors quite commonly come autumn, once it starts getting a little chilly outside. They are usually seen more rarely indoors in the summer.  However, it's not at all autumnal at the moment. Maybe this one doesn't like the rain?

Read More
Posted in web | No comments

Sunday, 5 August 2012

tracking down mad dancers, eventually

Posted on 05:12 by Unknown
So, I was looking for the source of the quotation “Those who dance appear insane to those who cannot hear the music”. Googling, everyone says it's Nietzsche, but of course, hardly anyone gives a source. One suggestion I did find was that it comes from The Birth of Tragedy (originally written in 1872), and helpfully included a fairly substantial quotation.  I couldn’t find a source that exactly matched the provided snippet, but I did find one very close:
In the German Middle Ages under the same power of Dionysus constantly growing hordes waltzed from place to place, singing and dancing. In that St. John's and St. Vitus's dancing we recognize the Bacchic chorus of the Greeks once again, and its precursors in Asia Minor, right back to Babylon and the orgiastic Sacaea.
     There are men who, from a lack of experience or out of apathy, turn mockingly away from such phenomena as from a "sickness of the people," with a sense of their own health and filled with pity. These poor people naturally do not have any sense of how deathly and ghost-like this very "Health" of theirs sounds, when the glowing life of the Dionysian throng roars past them.
Friedrich Wilhelm Nietzsche: The Birth of Tragedy, NuVision ebook, 2004
However, while tracking this down, I found a different translation:
So also in the German Middle Ages singing and dancing crowds, ever increasing in number, were whirled from place to place under this same Dionysian impulse. In these dancers of St. John and St. Vitus, we rediscover the Bacchic choruses of the Greeks, with their early history in Asia Minor, as far back as Babylon and the orgiastic Sacaea. There are some, who, from obtuseness, or lack of experience, will deprecate such phenomena as "folk-diseases," with contempt or pity born of the consciousness of their own "healthy-mindedness." But, of course, such poor wretches can not imagine how anemic and ghastly their so-called "healthy-mindedness" seems in contrast to the glowing life of the Dionysian revellers rushing past them.
Friedrich Wilhelm Nietzsche, The Birth of Tragedy. In Albert Hofstadter, Richard Kuhns, Philosophies of Art and Beauty: Selected Readings in Aesthetics from Plato to Heidegger, University of Chicago Press, 1964 (p501) (translation, Clifton P. Fadiman, 1927)
And yet another one:
In the German Middle ages, too, ever-growing throngs roamed from place to place, impelled by the same Dionysiac power, singing and dancing as they went; in these St John's and St Vitus' dancers we recognize the Bacchic choruses of the Greeks, with their pre-history in Asia Minor, extending to Babylon and the orgiastic Sacaea. There are those who, whether from lack of experience or from dullness of spirit, turn away in scorn or pity from such phenomena, regarding them as `popular diseases' while believing in their own good health; of course, these poor creatures have not the slightest inkling of how spectral and deathly pale their 'health' seems when the glowing life of Dionysiac enthusiasts storms past them.
Friedrich Wilhelm Nietzsche: The Birth of Tragedy and Other Writings, Cambridge University Press, 1999 (translation, Ronald Spiers), pp17-18 
One thing that struck me was the sheer variety in these translations. Just pulling our a single phrase (let's take one that has something to do with the original search), shows the great variety of translations possible:
  1. under the same power of Dionysus constantly growing hordes waltzed from place to place, singing and dancing 
  2. singing and dancing crowds, ever increasing in number, were whirled from place to place under this same Dionysian impulse 
  3. ever-growing throngs roamed from place to place, impelled by the same Dionysiac power, singing and dancing as they went 
While we have hordes waltzing, crowds whirling, and throngs roaming, they are all nevertheless uniformly “singing and dancing”. Similarly with the final phrase:
  1. when the glowing life of the Dionysian throng roars past them 
  2. the glowing life of the Dionysian revellers rushing past them 
  3. when the glowing life of Dionysiac enthusiasts storms past them 
Throngs roar, revellers rush, and enthusiasts storm, but all with “glowing life”. It makes one wonder – how much do translators read earlier translations, how much do they consciously decide to change certain phrases and orderings, and why they leave other phrases the same?

But another thing struck me, which was more relevant to my original quest: although close, none of these passages seem to capture the full spirit of the original search topic: “Those who dance appear insane to those who cannot hear the music”.

A link from that original helpful site took me to a discussion about the source being Henri Bergson. The Bergson quote is given in the original French, and in translation, as
  • Il suffit que nous bouchions nos oreilles au son de la musique, dans un salon où l'on danse pour que les danseurs nous paraissent aussitôt ridicules
  • “It is enough for us to stop up our ears to the sound of music, in a room where people are dancing, in order for the dancers to at once appear ridiculous.” 
Henri Bergson, Le Rire. Essai sur la signification du comique, 1900
Henri Bergson, “Laughter, an essay on the meaning of the comic”, 1900 
Note Bergson says “ridicule” (ridiculous), not “fou” (mad, crazy, wild, foolish).   Nevertheless, this looks closer to the quote than the Nietzsche passage.  So I felt satisfied.

However, whilst searching around for an image of "mad dancers" to enliven this large wodge of text, I came across a website containing a copy of Meyer Levin’s The Golden Mountain (1932), which is “a collection of tales of the Eastern European Hassidic Jews”. It includes the tale of “The Mad Dancers”:
a deaf man passed outside the house; he looked in through the window and saw the people whirling about the room, leaping, and throwing about their arms. 'See how they fling themselves about!' he cried, 'it is a house filled with madmen!' For he could not hear the music to which they danced. 
Now, this seems much closer, and I suspect may be the "true" source. I wonder how much each might have been influenced, directly or indirectly, by the earlier publications?
Read More
Posted in history, humour, language, quotations, web | No comments

Sunday, 10 June 2012

search history

Posted on 13:56 by Unknown
I was writing a paper, and as a conclusion to a short section, I wanted to put "Life is a verb, not a noun".  Now, that sounds like something someone has probably said before, so I thought I would check, in case I needed to reference it.  I found the source as follows:
  • I Google “Life is a verb, not a noun”.
  • Lots of entries say it's by Charlotte Perkins Gilman, but none give a source (as usual)
  • I Google “Charlotte Perkins Gilman wikiquote”
  • I follow the link to http://en.wikiquote.org/wiki/Charlotte_Perkins_Gilman
  • It’s not there
  • I Google “Charlotte Perkins Gilman Life is a verb, not a noun”
  • One of the entries this time looks more like like a source: I can see that it has a reference in it, to a (p. xv)
  • I follow link to http://www.h-net.org/reviews/showrev.php?id=33118
  • It’s a review by Cara L. Burnidge, of Charlotte Perkins Gilman: a biography, by Cynthia J. Davis, with a link to the book itself at Amazon.com
  • I follow link to http://www.amazon.com/exec/obidos/ASIN/0804738890
  • The Amazon page has a “look inside” version of the book, so I look to see if p.xv is included. It is, and has the quote, but no source. However, the same paragraph has several other quotes, and then an endnote reference 10.
  • I look to see if endnote 10 is included in the “look inside” version. It is, on p.409, where it says “she calls 'life' a verb in HW, 203”, which sounds like it could be the source.
  • I assume 203 is a page reference, and that HW is an abbreviation for the source. What is HW?
  • I look to see if the abbreviations are included in the “look inside” version. They are; HW = Human Work
  • I Google “Charlotte Perkins Gilman Human Work”
  • There's a Google books version at http://books.google.co.uk/books/about/Human_work.html?id=IHoEAAAAYAAJ&redir_esc=y.
  • I follow the link to the book; it’s not searchable.
  • Back to Google Results page; there's another version at http://books.google.co.uk/books/about/Human_Work.html?id=y8Gif_Ni0L0C&redir_esc=y
  • I follow the link to the book; this one is searchable.
  • I search for “verb”; there are many hits; one is on p.203. And there it is:
  • I go to the beginning of the book, and get the rest of the bibliographic details.
"Life is a verb, not a noun."
Charlotte Perkins Gilman, Human Work, p203. McClure, Philips and Co, 1904.

Elapsed time, less than 15 minutes.
Try that with a paper library!

Maybe I should add it to wikiquotes...
Read More
Posted in books, quotations, research, web | No comments
Older Posts Home
Subscribe to: Posts (Atom)

Popular Posts

  • hyperbolic hyperbole
    What's with hyperbolic discounting? It's everywhere ! I first consciously noticed the term at a workshop about six weeks ago, and n...
  • better use seaweed
    As Neils Bohr is alleged to have said , “prediction is very difficult, especially about the future”. My smartphone has a weather app on it t...
  • oh dear
    We have a garden pond to help encourage frogs and other amphibians. Hedgehogs may suffer, however. :-(
  • "Windows support" -- not
    Just had another scam phone call -- someone with a strong Indian accent claiming to be calling from "Windows Technical Support" (o...
  • national stereotypes
    I've just got back from a very productive three day meeting in Paris. Just around the corner from where I was working, there was a marv...
  • retrospective holiday diary day 1: travelling north
    We went to the Lake District last “summer” ; this “summer” it was time for touring the other side of the country: Northumbria. The holiday s...
  • retrospective holiday diary day 5: trains
    Monday 24 September, and the long-threatened rain finally arrived. So this was the ideal day for the planned Carlisle-Settle rail trip . Bu...
  • funfair mirror trees
    One of the trees in our garden has died.  It died last summer in the drought, but we gave it a year to prove to us it really was dead.  It i...
  • retrospective holiday diary day 3: Lindisfarne
    Saturday 22 September, and the weather was still fine, sunny holiday weather so we decided to take advantage of the sunshine, and do Lindisf...
  • more scammers
    So not long after the scam phone call , the phone rings again. It's British Gas -- they get to call me because I'm actually a custo...

Categories

  • 3D printer
  • algorithm
  • astronomy
  • birds
  • Bonnie Tyler
  • books
  • cognition
  • computer
  • conference
  • Doctor Who
  • driving
  • ducks
  • duodecimal
  • education
  • electricity
  • estimation
  • Evernote
  • evolution
  • font
  • food
  • fractals
  • game
  • garden
  • graphics
  • grimoire
  • history
  • holiday
  • humour
  • language
  • LaTeX
  • lego
  • lol
  • mathematics
  • medicine
  • money
  • music
  • obituary
  • pedantry
  • politics
  • probability
  • psychology
  • publishing
  • python
  • quotations
  • research
  • robots
  • science
  • science fiction
  • space flight
  • statistics
  • TPS
  • trains
  • tree
  • TV
  • weather
  • web

Blog Archive

  • ▼  2013 (119)
    • ▼  December (1)
      • that's not in the least bit suspicious
    • ►  November (17)
    • ►  October (12)
    • ►  September (10)
    • ►  August (9)
    • ►  July (8)
    • ►  June (10)
    • ►  May (19)
    • ►  April (10)
    • ►  March (9)
    • ►  February (4)
    • ►  January (10)
  • ►  2012 (103)
    • ►  December (16)
    • ►  November (8)
    • ►  October (14)
    • ►  September (6)
    • ►  August (13)
    • ►  July (8)
    • ►  June (6)
    • ►  May (9)
    • ►  April (10)
    • ►  March (7)
    • ►  February (5)
    • ►  January (1)
  • ►  2011 (79)
    • ►  December (7)
    • ►  November (5)
    • ►  October (10)
    • ►  September (7)
    • ►  August (6)
    • ►  July (5)
    • ►  June (6)
    • ►  May (6)
    • ►  April (9)
    • ►  March (9)
    • ►  February (3)
    • ►  January (6)
Powered by Blogger.

About Me

Unknown
View my complete profile